Latest Projections
Results of the 2019 Long-term Projection
Population forecast, age limits and the life expectancy coefficient
The 2018 population forecast of Statistics Finland is used in the baseline projection. According to the forecast, the Finnish population will decline as of 2035. At the end of 2017, the population numbered 5.51 million. It is expected to increase to 5.62 million by 2035 and decrease t0 5.15 million by 2085.
For those born in 1955 or later, the retirement age will rise by 3 months per age cohort until it is 65 years for those born in 1962. For those born in 1965 or later, the general retirement age will be linked to the development of the life expectancy coefficient. The old-age pension amount will be adjusted with the life expectancy coefficient according to changes in the expected life expectancy. The life expectancy coefficient is confirmed for each age cohort at the age of 62. In 2030, the value of the life expectancy coefficient will be 0.914. In 2085, it will be 0.849. A target retirement age will be determined for each age cohort. The effects of the life expectancy coefficient can be offset by not taking out the pension before reaching the target retirement age.
Age limits of the earnings-related pension system
| Year of birth | Retirement age | Target retirement age | Age at which insurance obligation ends |
|---|---|---|---|
| 1955 | 63 years 3 months | 64 years 1 month | 68 years |
| 1960 | 64 years 6 months | 65 years 10 months | 69 years |
| 1965 | 65 years 2 months | 67 years | 70 years |
| 1970 | 65 years 8 months | 67 years 9 months | 70 years |
| 1975 | 66 years 2 months | 68 years 6 months | 70 years |
| 1980 | 66 years 8 months | 69 years 2 months | 70 years |
| 1985 | 67 years 1 month | 69 years 10 months | 70 years |
| 1990 | 67 years 5 months | 70 years | |
| 1995 | 67 years 10 months | 70 years | |
| 2000 | 68 years 2 months | 70 years |
Pension expenditure and pension levels
This section shows the development of pension expenditure, pension levels and the contribution under the Employees Pensions Act (TyEL) in three economic scenarios: the baseline and both the optimistic and the pessimistic economic scenarios. The alternatives differ in terms of employment rate, growth of earnings and return on pension assets.
Employment rate, growth of earnings and return on pension assets in the different scenarios
| OPTIMISTIC | BASELINE | PESSIMISTIC | |
|---|---|---|---|
| Average employment rate 2020-2085 | 75.7 % | 73.5 % | 71.3 % |
| Real growth of earnings, % | 2.0 | 1.5 | 1.0 |
| Real return on pension assets, % | 1 percentage point above the baseline projection | 2.5% in 2019-2028, 3.5 % as of 2029 | 1 percentage point below the baseline projection |
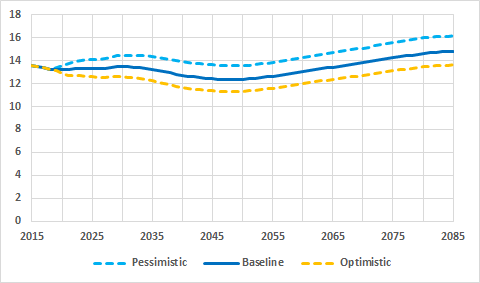
In 2017, the total statutory pension expenditure was 13.4 per cent of GDP. The ratio of the pension expenditure to GDP will remain close to its current level until 2030. It will be at its highest in the 2030s: 13.5 per cent in the baseline projection and 14.5 per cent in the pessimistic projection. After 2030, the number of retirees will slowly decline and the average pension relative to the earnings will fall. These factors result in a decreased pension expenditure relative to GDP. By 2045, the ratio will go down to 12.5 per cent in the baseline projection, 13.7 per cent in the pessimistic projection and 11.4 per cent in the optimistic projection. Around 2050, the average pension relative to the average wage will fall at a slower pace and the number of pension recipients will continue to grow. As a result, the ratio of pension expenditure to GDP will start to grow. This trend will continue until the latter half of the century. In the long run, in the optimistic scenario, the pension expenditure relative to GDP will be 1.2 percentage points below that of the baseline projection. In the pessimistic scenario, the pension expenditure relative to GDP will be 1.4 percentage points above that in the baseline projection.
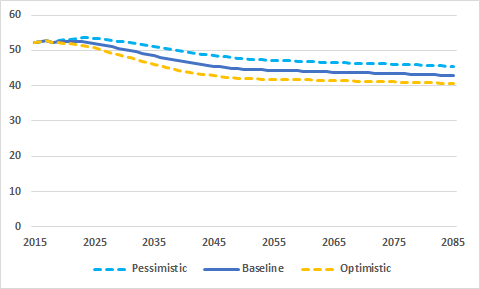
During the projection period, the purchasing power of the average pension will continue to rise as a result of the increase in earnings. As of 2023, the ratio between the average pension and the average earnings will begin to decline. The most important reason for the drop in the relative pension level is the life expectancy coefficient, which adapts the benefit level to correspond to changes in life expectancy.
The purchasing power of pensions is the highest in the optimistic scenario and the lowest in the pessimistic scenario, since the earnings-related pension is determined based on earnings. In relation to the general earnings level, the pension level is highest in the pessimistic scenario since the earnings-related pension index and the wage coefficient will lag behind the growth in earnings the least in that scenario.
Statutory pension expenditure, % of GDP
Average pension, % of average wage
TyEL contribution
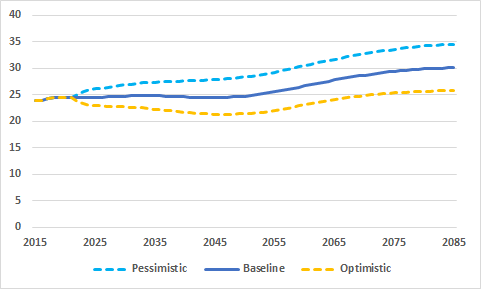
In the baseline projection, the contribution rate under the Employees Pensions Act (TyEL contribution) will remain below 25 per cent until the year 2050. In the latter half of the century, the TyEL contribution will rise steeply as the TyEL pension expenditure grows due to changes in demography. In the baseline projection, the TyEL contribution will be 30.5 per cent of the payroll at the end of the projection period. In the optimistic scenario, the contribution rate will be 2.1 percentage points below the baseline projection by 2030. In the pessimistic scenario, it will rise to 2.1 percentage points above the baseline projection. By 2085, the contribution will be 4.4 percentage points below the baseline projection in the optimistic scenario and 4.4 percentage points above the baseline projection in the pessimistic scenario.
TyEL contribution, % of wages
Read more:
- Long-term projections 2019
- Long-term pension calculation based on the 2019 population projection of Statistics Finland (in Finnish)
- Laskelmia vuoden 2017 työeläkeuudistuksen vaikutuksista
Projections on the effects of the 2017 earnings-related pension reform, English Summary - Effects of the 2017 earnings-related pension reform: projections based on the government bill