Economic Welfare of Pensioners
According to research, the income of pensioners has improved in the last 20 years. This is evident when looking at most key indicators of income. The financial situation of pensioners relative to wage earners has remained unchanged. As a rule, pensioners on a disability pension, single pensioners and elderly women have the lowest income.
Higher disposable income
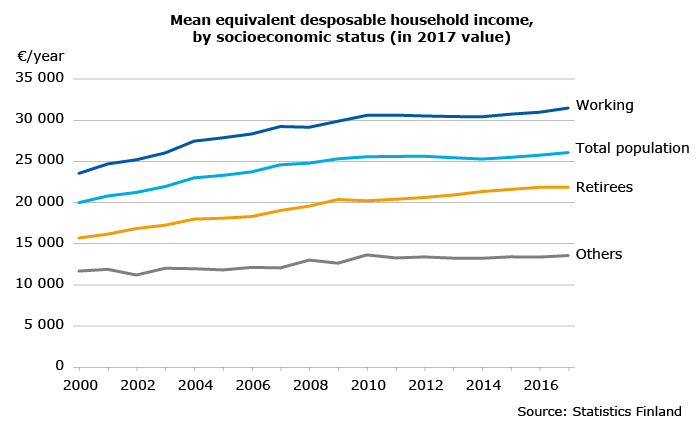
In 2017, the average income of pensioners was 21,800 euros per year or roughly 1,800 euros per month. Compared to the year 2000, the income has grown in real-terms by 40 per cent.
Pensioners’ income amount to roughly 69 per cent of the income of wage earners and the self-employed and 84 per cent of the income of the total population. Best off are those working and worst off are those who are not working in a profession (students and long-term unemployed).
The economic situation affect the position of pensioners relative to the other population groups. During an economic boom, when employment rates and wages go up, the position of pensioners relative to the working population weakens. During a recession, the development is the opposite and the situation of pensioners improves relative to the working population.

Pensioners’ income is assessed based on the equivalent income. The equivalent income depicts the household’s disposable income per consumption unit. The equivalent income is a widely used concept in income research. When calculating the equivalent income, the gross income of all members of a household are taken into consideration, as well as the taxes and fees that the household has paid. Households of different size are not directly comparable, however. That is why the household income is converted on a consumption unit scale to a member-specific equivalent income. The number of members and the structure of the household are taken into consideration in the calculation.
Pensions the most important source of income for pensioners
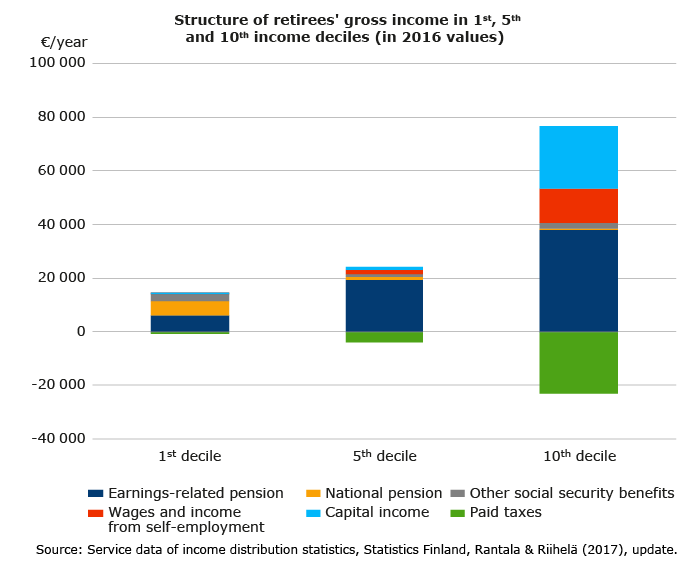
There are pensioners with low, average and high incomes. The income level is evident also in the income structure. For pensioners with an average income, the earnings-related pension accounts for 80 per cent of their gross income. The national pension, earnings, capital income and income from other social benefits accounted for 5 per cent each. Pensioners with an average income pay taxes and fees to the amount of 20 per cent of their gross income.
The income of pensioners who belong to the lowest income decile is one third smaller than that of the pensioners with an average income. Earnings-related pensions account for about half of their gross income. The other half consists of the national pension and other social benefits, such as the housing allowance and income support for pensioners. They pay a relatively small share of their gross income in taxes.
The income of pensioners in the highest income decile are more than 1.5 times higher than that of pensioners with an average income. In addition to earnings-related pensions, earnings and capital income form a considerable source of income for them. They pay slightly less than one third of their gross income in taxes.

Poverty risk the same for pensioners as for other population groups
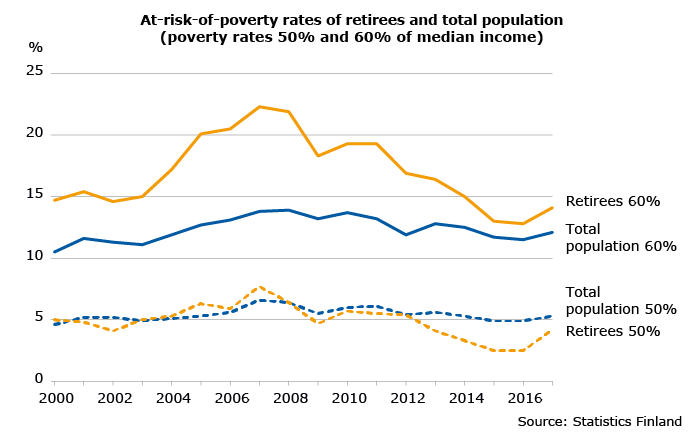
In 2017, the poverty rate (with a 60% limit) for pensioners was 14.1 per cent, slightly higher than for the total population. With a 50 per cent limit, the poverty rate for pensioners was slightly lower than for the total population.
Compared to the year 2000, the poverty rate of pensioners has gone down slightly. The poverty rate of the total population has remained virtually unchanged.
Among pensioners, the share of low income people varies more greatly over time than it does among the total population. The variation depends on how the limit for low income changes since, in contrast to the overall population, the income distribution among pensioners focuses more closely on the 60-per-cent limit. This way the changes the low income limits affect the most on the number of low-income pensioners and, hence, on the poverty rate of pensioners. If the 50-per-cent limit is used, the variation over time is lesser.
The poverty rate depicts the share of the population (relative to the total population) that falls below the poverty limit. The poverty limit officially applied by the EU has been set at 60 per cent of the equivalent median income of all households. The OECD has set the poverty limit at 50 per cent.

More research on pensioners’ income
The aim of the research done at the Finnish Centre for Pensions is to produce a versatile view of the income of pensioners. This requires that income is reviewed from many different angles. It has to be studied via pension levels and using standard indicators in income research: disposable income, consumption, wealth, perceived income and material deprivation.
Our research produces information on how the set aims for pension policy – securing a reasonable income and preventing poverty – have been realised.
Read more on pensioners’ income in the following studies:
- Pensions and Pensioners’ Economic Welfare 1995-2015
- The Economic Welfare of Disability Pensioners in the 2000s
- Income Differences between Retired Women and Men in 1995-2013
- Pensioners’ Perceived Economic Welfare in 2017
- The Impact of Social and Health Care Services on Retirees Income
- Pensioners’ Subjective Economic Well-being in European Countries: Comparison behind the Income Satisfaction Paradox